
If you buy cooking oil, soap, chocolate, cosmetics or biodiesel anywhere in the world, there is a good chance part of it started on a plantation in Sumatra or Kalimantan. Indonesia is the world's largest producer and exporter of palm oil, and the crop is one of the country's biggest foreign-exchange earners.
In 2025 Indonesia exported 32.3 million tonnes of palm oil and palm-based products worth US$35.9 billion, up 9.5% in volume and 29.2% in value on 2024, according to the Indonesian Palm Oil Association (GAPKI). This guide breaks down the numbers by product, HS code and destination, and looks at what 2026 holds for buyers and exporters.
Indonesia palm oil exports at a glance (2025)
| Indicator | 2024 | 2025 | Change |
|---|---|---|---|
| Production (CPO + palm kernel oil) | 52.76 Mt | 56.55 Mt | +7.2% |
| Export volume (all palm products) | 29.54 Mt | 32.34 Mt | +9.5% |
| Export value (all palm products) | US$27.76 bn | US$35.87 bn | +29.2% |
| Domestic consumption | 23.86 Mt | 24.77 Mt | +3.8% |
| Average CPO price (CIF Rotterdam) | US$1,084/t | US$1,221/t | +12.6% |
| Year-end stocks | 2.58 Mt | 2.07 Mt | -19.8% |
Mt = million tonnes. Source: GAPKI annual figures for 2025.
Value grew three times faster than volume because prices were higher. Stocks fell by almost a fifth, which means 2026 started with a tighter supply cushion.
Indonesia's share of the world palm oil market
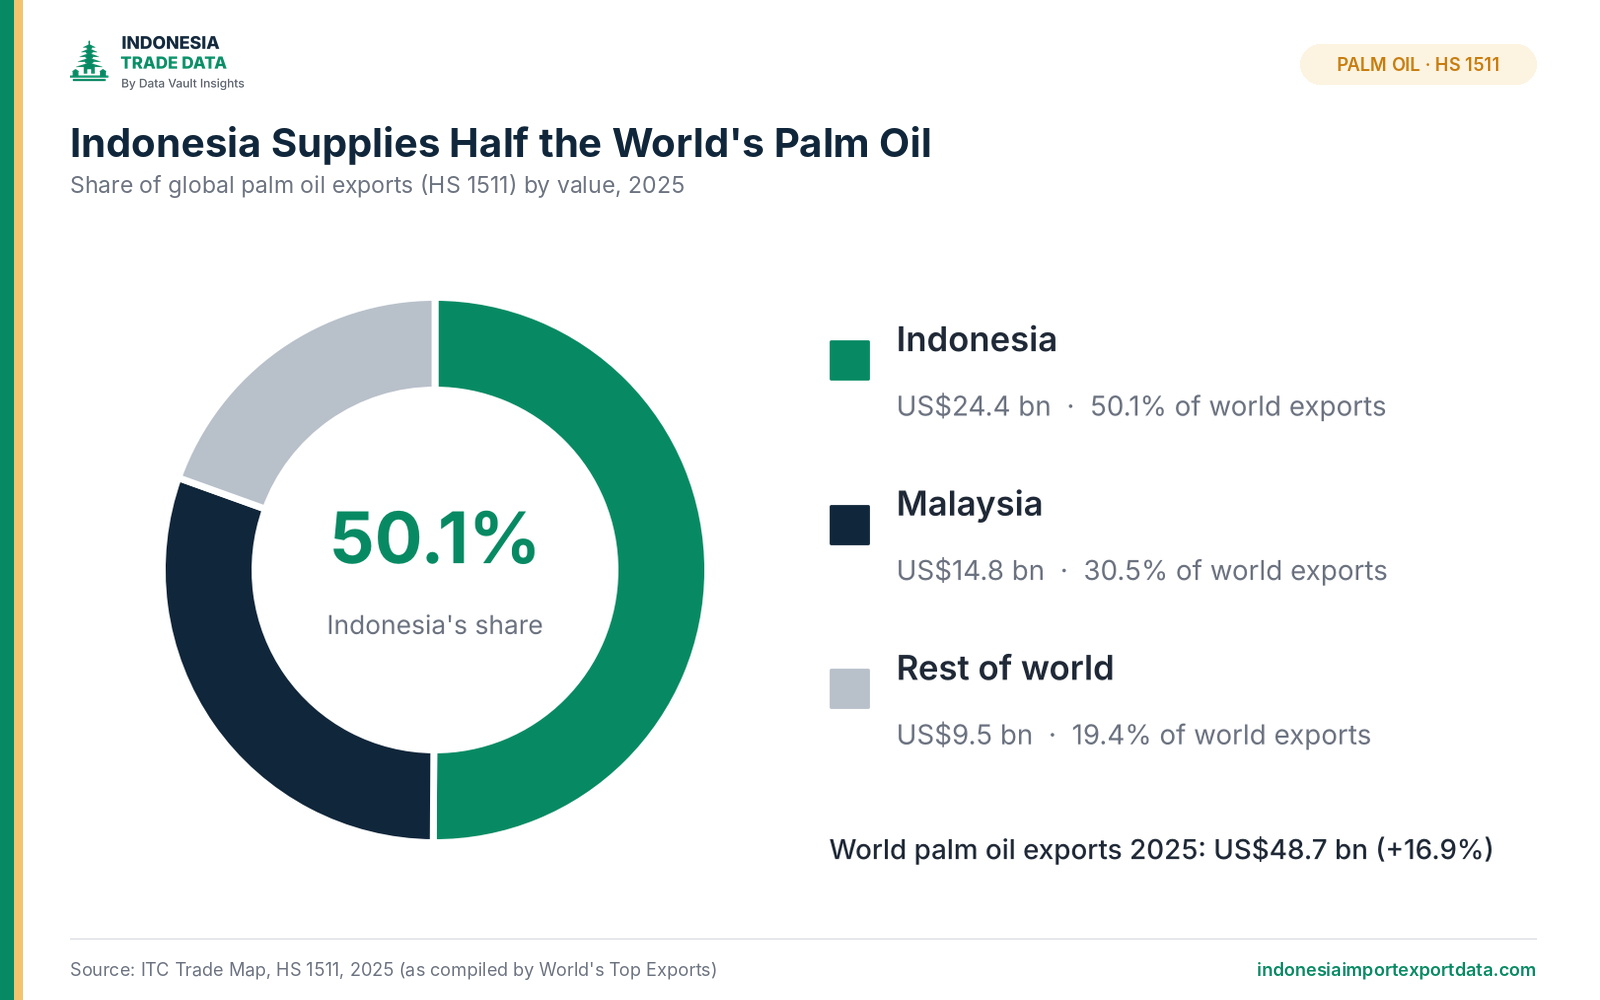
Looking only at palm oil itself (HS 1511, crude and refined), ITC Trade Map data shows world exports of US$48.7 billion in 2025. Indonesia shipped US$24.4 billion of that, which is 50.1% of the global total. Together with Malaysia, the two countries supply more than 80% of all palm oil traded worldwide.
| Rank | Exporter | HS 1511 exports 2025 | World share |
|---|---|---|---|
| 1 | Indonesia | US$24.4 bn | 50.1% |
| 2 | Malaysia | US$14.8 bn | 30.5% |
| 3 | Thailand | US$1.41 bn | 2.9% |
| 4 | Netherlands (re-export) | US$1.28 bn | 2.6% |
| 5 | Papua New Guinea | US$0.87 bn | 1.8% |
| 6 | Colombia | US$0.81 bn | 1.7% |
| 7 | Guatemala | US$0.62 bn | 1.3% |
Why two different totals? The US$24.4 billion figure covers HS 1511 only (palm oil and its fractions). GAPKI's US$35.9 billion also includes palm kernel oil, oleochemicals, margarine-type products and other palm derivatives, which fall under other HS codes. Both are correct; they just measure different baskets.
Palm oil HS codes: what each one covers
If you search shipment records, the HS code decides what you see. These are the main codes for Indonesian palm products:
| HS code | Product | Typical buyers |
|---|---|---|
| 1511.10 | Crude palm oil (CPO) | Refineries in India, Pakistan, Malaysia, Europe |
| 1511.90 | Refined palm oil, RBD olein and stearin | Food makers, cooking-oil packers, bakeries |
| 1513.21 / 1513.29 | Crude and refined palm kernel oil (PKO) | Soap, cosmetics, confectionery |
| 1516.20 | Hydrogenated and interesterified vegetable fats | Food industry, shortening makers |
| 1517.90 | Margarine, shortening and edible fat blends | Bakeries, snack and noodle makers |
| 3823.19 / 3823.70 | Fatty acids and fatty alcohols (oleochemicals) | Detergent, personal care, plastics, lubricants |
| 3826.00 | Biodiesel (palm methyl ester) | Fuel blenders |
| 2306.60 | Palm kernel cake / expeller | Animal feed makers |
You can pull monthly shipments for any of these under HS 15 animal and vegetable fats and oils.
Who buys Indonesia's palm oil?
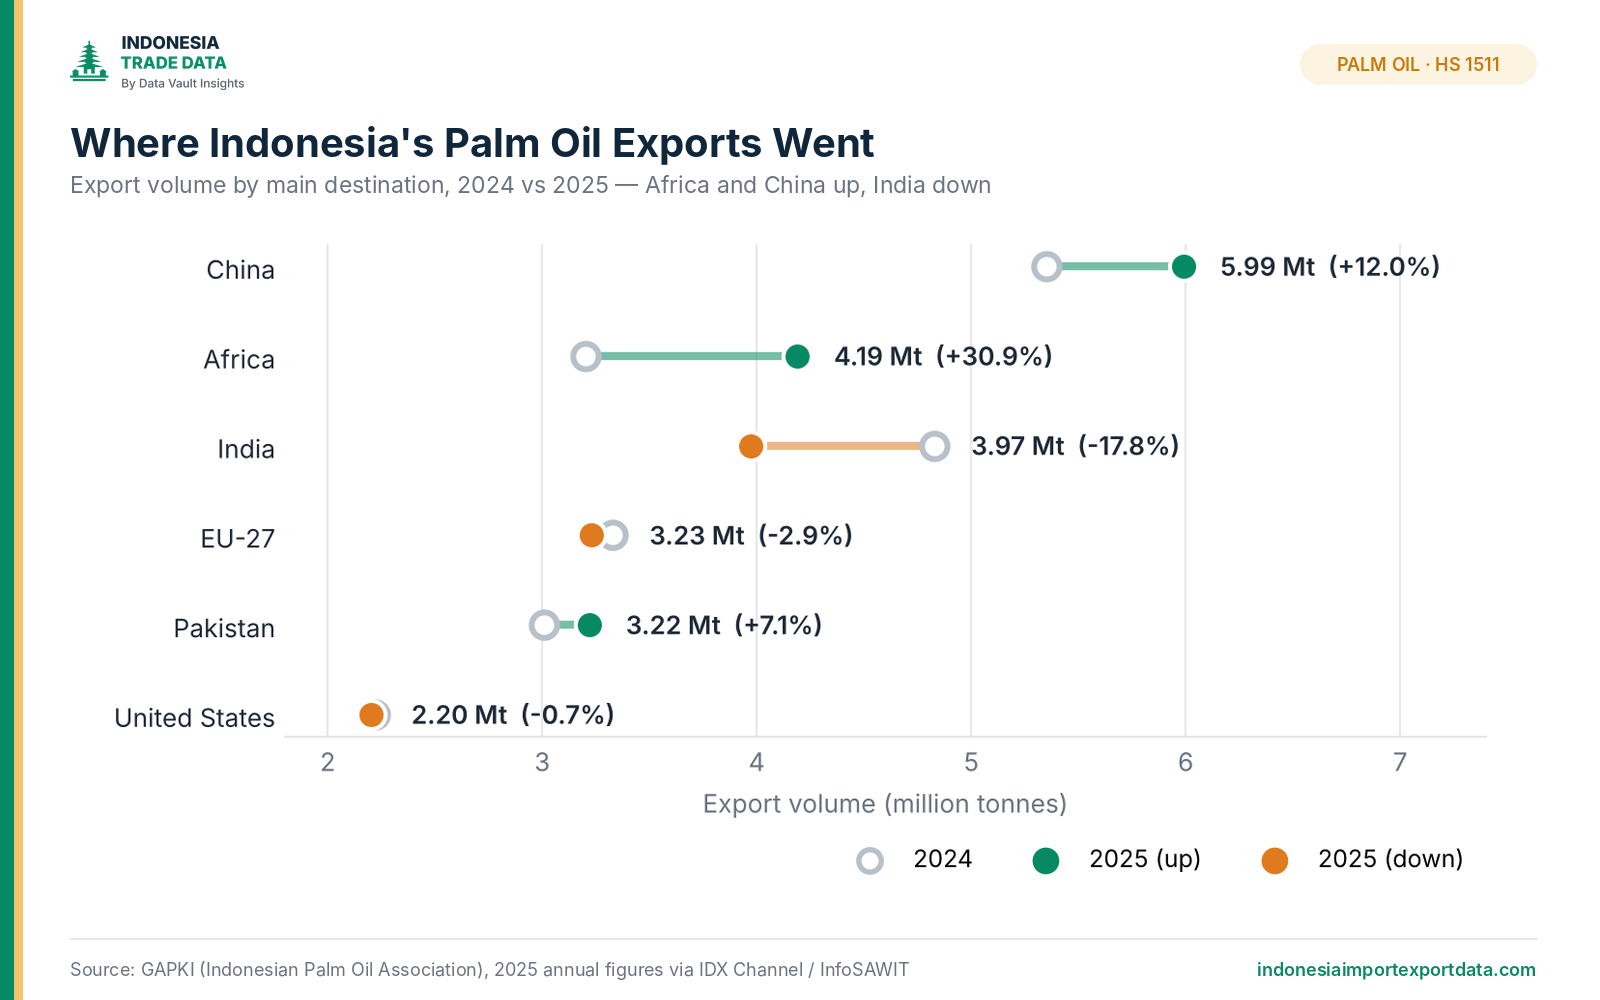
China overtook India as Indonesia's largest palm oil market in 2025. Africa was the fastest-growing region, while shipments to India fell sharply as Indian buyers switched part of their demand to soybean and sunflower oil and bought more from Malaysia.
| Destination | 2024 volume | 2025 volume | Change |
|---|---|---|---|
| China | 5.35 Mt | 5.99 Mt | +12.0% |
| Africa (all countries) | 3.20 Mt | 4.19 Mt | +30.9% |
| India | 4.83 Mt | 3.97 Mt | -17.8% |
| European Union (27) | 3.33 Mt | 3.23 Mt | -2.9% |
| Pakistan | 3.01 Mt | 3.22 Mt | +7.1% |
| United States | 2.22 Mt | 2.20 Mt | -0.7% |
| Others (Bangladesh, Malaysia, Middle East and more) | – | 9.54 Mt | – |
Among the smaller markets, GAPKI reports strong gains in Bangladesh (+503,000 t) and Malaysia (+516,000 t), where Malaysian refiners buy Indonesian crude to process and re-export.
Crude vs processed: what Indonesia actually ships
Indonesia no longer exports much raw crude palm oil. Higher export levies on CPO push companies to refine at home, so most shipments now leave as refined oil, olein, stearin or oleochemicals.
| Export product type | 2024 | 2025 |
|---|---|---|
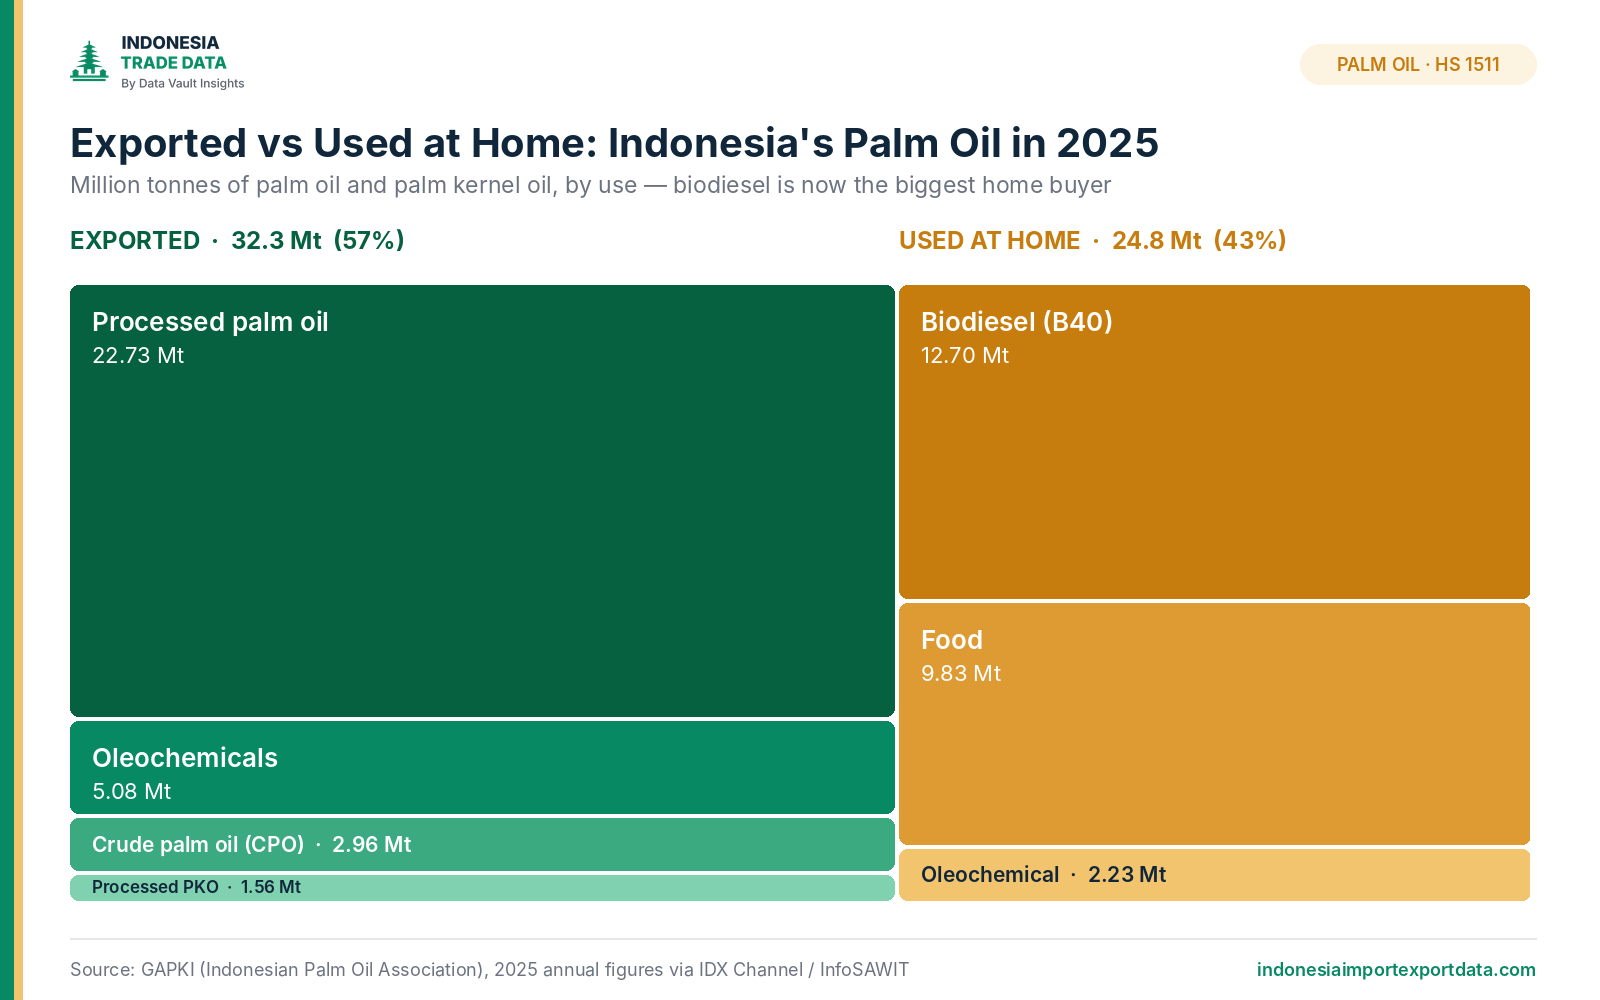
| Processed (refined) palm oil | 20.45 Mt | 22.73 Mt |
| Oleochemicals | 4.80 Mt | 5.08 Mt |
| Crude palm oil (CPO) | 2.92 Mt | 2.96 Mt |
| Processed palm kernel oil | 1.26 Mt | 1.56 Mt |
Crude palm oil is now less than 10% of export volume. For importers, this means you are far more likely to find Indonesian suppliers of RBD olein or fatty acids than of CPO.
Exports vs the home market: the biodiesel factor
The biggest change in Indonesian palm oil is happening at home. Under the B40 biodiesel mandate, 12.7 million tonnes of palm oil went into fuel in 2025, more than went into food (9.8 Mt). That oil is no longer available for export.
| Domestic use | 2024 | 2025 | Change |
|---|---|---|---|
| Biodiesel | 11.45 Mt | 12.70 Mt | +11.0% |
| Food | 10.21 Mt | 9.83 Mt | -3.6% |
| Oleochemicals | 2.21 Mt | 2.23 Mt | +1.2% |
| Total domestic | 23.86 Mt | 24.77 Mt | +3.8% |
2026 so far: slower growth, B50 and a higher levy
BPS data shows palm oil exports in the first half of 2026 reached US$12.27 billion (+7.3% year on year) on a volume of 11.28 million tonnes (+2.5%). That is still growth, but much slower than the 24.8% value jump seen in H1 2025.
Two policy changes explain most of the slowdown:
| Policy | What changed | Effect on exports |
|---|---|---|
| CPO export levy | Raised from 10% to 12.5% of the CPO reference price from March 2026 | Makes crude exports dearer; pushes more refining at home |
| B50 biodiesel mandate | Blend raised from 40% to 50% palm biodiesel from 1 July 2026 | GAPKI estimates about 1.9 Mt of extra domestic demand, so less oil left to export |
GAPKI has warned of a "quite a significant drop" in exports as B50 ramps up. The full effect should show in BPS trade data from the second half of 2026.
What this means for buyers and exporters
- Buyers should expect tighter supply. Lower stocks and B50 leave less oil to export. Lock in suppliers early and compare offers from several Indonesian refiners.
- Refined products are the main game. RBD olein, stearin and oleochemicals make up over 90% of export volume, so search by the right HS code (1511.90, 3823) rather than CPO alone.
- Africa and South Asia are growing. Exporters looking for new buyers should watch Africa, Bangladesh and Pakistan, where demand rose fastest in 2025.
- Get ready for EUDR. The EU Deforestation Regulation is due to apply to large companies from 30 December 2026. Palm oil sold into Europe will then need proof that it was not grown on recently deforested land, which favours certified, traceable exporters.
Find palm oil buyers and suppliers in Indonesia
Annual totals show where the market is heading. Shipment records show who is actually trading. With our Indonesia export data you can search palm oil shipments by 8-digit HS code and see the exporter, foreign buyer, quantity, value, port and destination, updated every month.
Browse the Indonesian exporter directory, check the HS code list, or request a free sample of palm oil export data.
Also read: Top 10 Products Indonesia Exports in 2026.
Indonesia Trade Data supplies shipment records only. We do not buy or sell any goods mentioned here; to trade, contact the companies in the records directly.
Want the shipment data behind this?
Ask for a free sample of Indonesia import or export records for your product.