
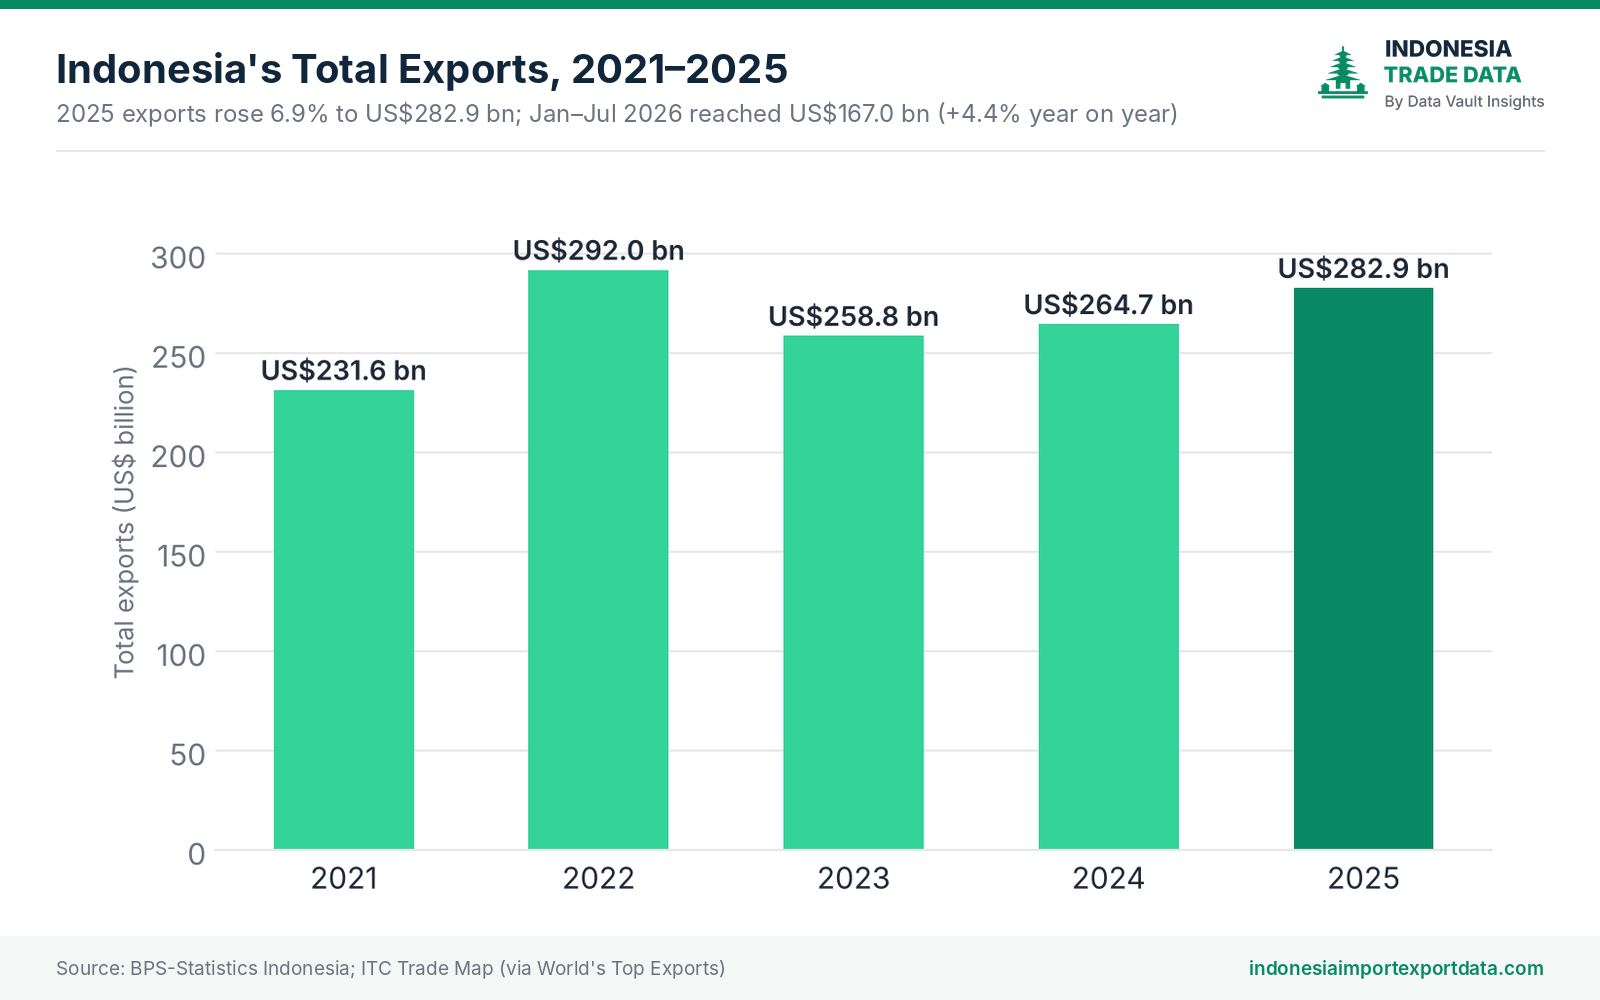
Indonesia is one of Asia's biggest exporters, and the shape of what it sells has been changing fast. In 2025 the country shipped US$282.9 billion of goods abroad, up 6.9% on 2024, and the first seven months of 2026 have kept the momentum going at US$167.0 billion (+4.4% year on year).
Just ten product groups account for 65.7% of everything Indonesia exports. Below we break down each one by HS code, export value and growth, using the latest full-year figures. All values are rounded and approximate, so use them as a guide and confirm exact figures in the trade records before you make decisions.
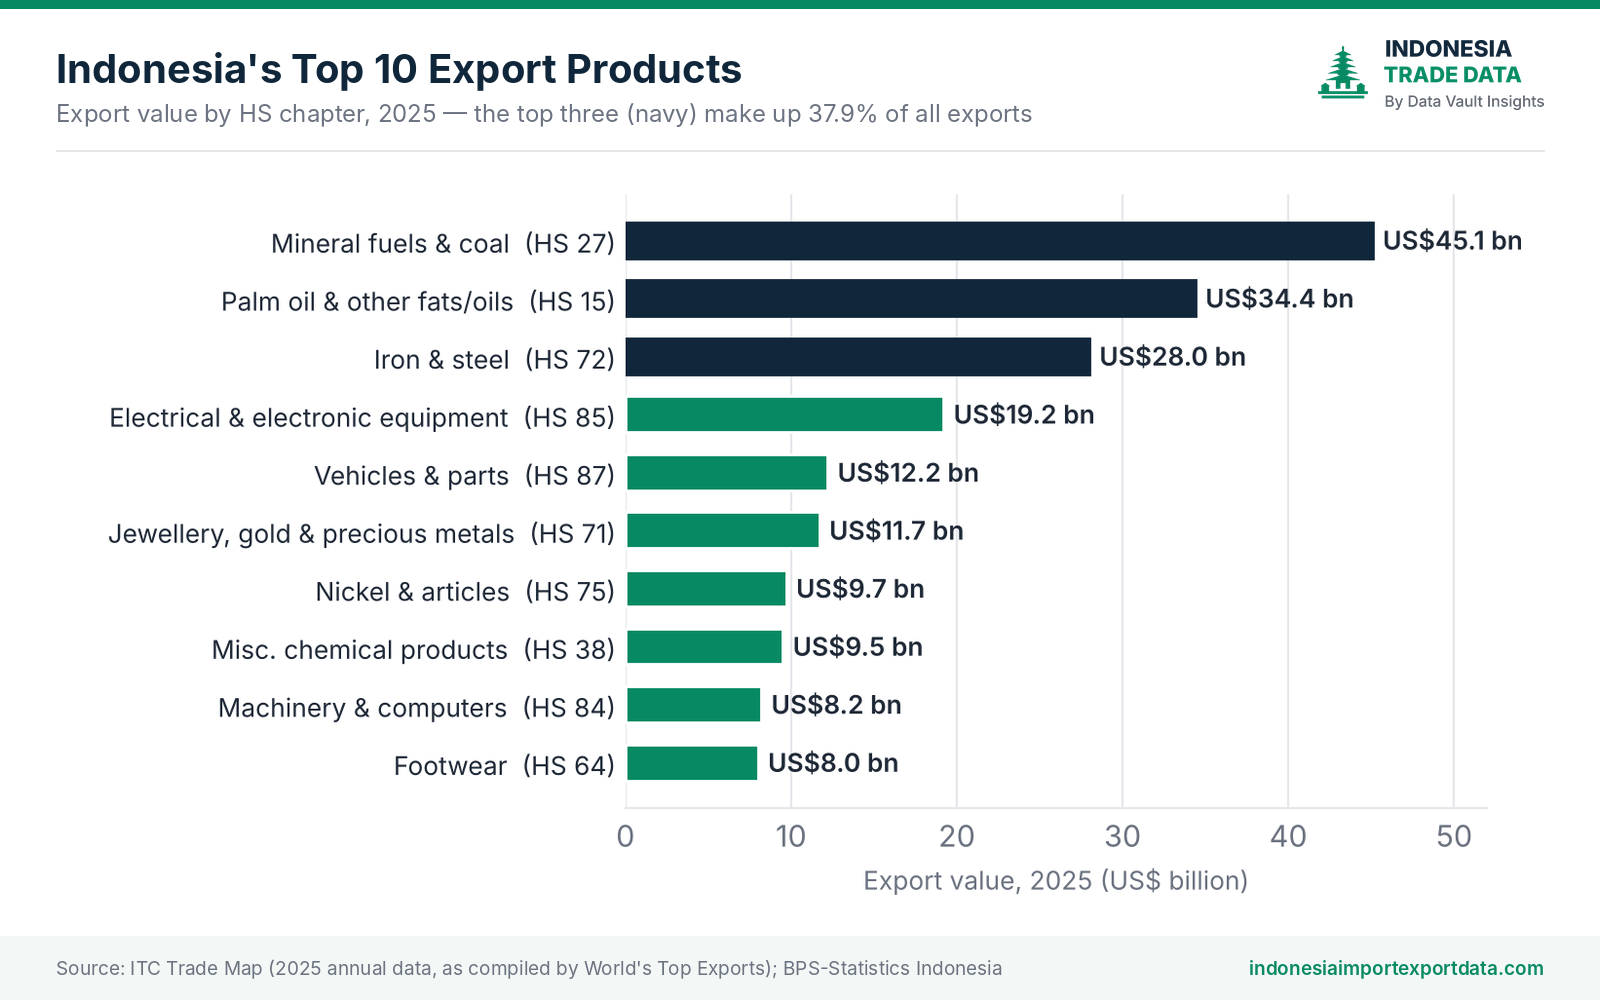
Indonesia's top 10 export products at a glance
The table below ranks the ten largest export groups at the 2-digit HS chapter level. "Share" is the portion of Indonesia's total 2025 exports.
| Rank | HS code | Product group | Export value 2025 | Share of total | Change vs 2024 |
|---|---|---|---|---|---|
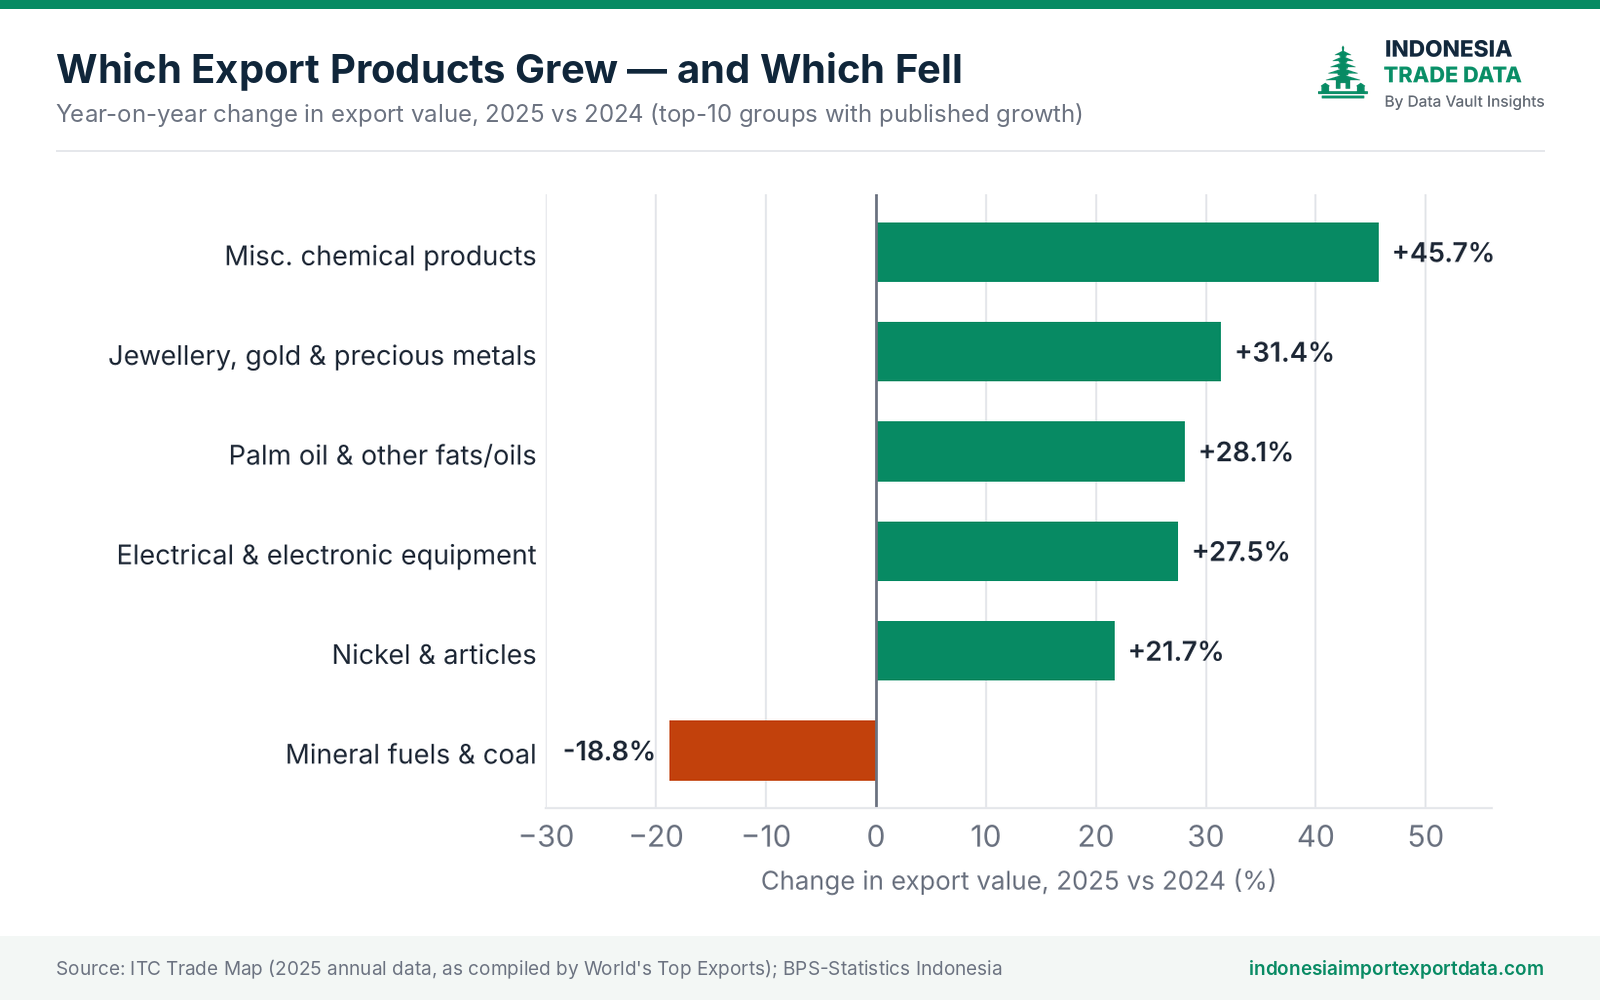
| 1 | 27 | Mineral fuels, oils & coal | US$45.1 bn | 15.9% | -18.8% |
| 2 | 15 | Animal & vegetable fats and oils (palm oil) | US$34.4 bn | 12.1% | +28.1% |
| 3 | 72 | Iron & steel | US$28.0 bn | 9.9% | n/a |
| 4 | 85 | Electrical machinery & equipment | US$19.2 bn | 6.8% | +27.5% |
| 5 | 87 | Vehicles & parts | US$12.2 bn | 4.3% | n/a |
| 6 | 71 | Gems, jewellery & precious metals | US$11.7 bn | 4.1% | +31.4% |
| 7 | 75 | Nickel & articles thereof | US$9.7 bn | 3.4% | +21.7% |
| 8 | 38 | Miscellaneous chemical products | US$9.5 bn | 3.4% | +45.7% |
| 9 | 84 | Machinery incl. computers | US$8.2 bn | 2.9% | n/a |
| 10 | 64 | Footwear | US$8.0 bn | 2.8% | n/a |
| Top 10 combined | US$186.0 bn | 65.7% |
n/a: a chapter-level growth rate is not available. Product-level changes are given in the sections below.

1. Mineral fuels and coal (HS 27) — US$45.1 billion
Coal is still Indonesia's single biggest export earner, but its lead is shrinking. Chapter 27 fell 18.8% in 2025 as global coal prices kept sliding, even though shipped volumes stayed high.
| HS code | Product | Value 2025 | Change vs 2024 |
|---|---|---|---|
| 2701 | Coal (bituminous and other) | US$24.5 bn | -19.7% |
| 2711 | Petroleum gases (LNG, LPG) | US$7.4 bn | -16.9% |
| 2702 | Lignite | US$5.7 bn | -22.0% |
| 2710 | Refined petroleum oils | US$3.4 bn | -7.7% |
| 2709 | Crude oil | US$1.6 bn | -30.2% |
For buyers, lower prices have made Indonesian thermal coal more competitive. For exporters, the squeeze on margins makes it more important than ever to know who is buying, at what price and through which ports. You can track every shipment under HS 27 mineral fuels.
2. Palm oil and other fats & oils (HS 15) — US$34.4 billion
Palm oil bounced back strongly in 2025, with the chapter up 28.1%. Higher prices and steady demand from food and oleochemical buyers lifted crude and refined palm oil to about US$24.4 billion on their own (+22%). Faster-growing lines include palm kernel and coconut oil (HS 1513, +59%), margarine and edible blends (HS 1517, +41%) and hydrogenated fats (HS 1516, +65%).
Indonesia's B40 biodiesel mandate keeps more crude palm oil at home, so watch export volumes closely through 2026. See monthly shipments in HS 15 palm oil and fats.
3. Iron and steel (HS 72) — US$28.0 billion
Iron and steel is the clearest result of Indonesia's downstreaming policy. Raw nickel ore exports are banned, so the ore is smelted locally into ferro-nickel and nickel pig iron, which are shipped as ferroalloys under HS 7202. These alone reached about US$16.5 billion (+17.2%).
- HS 7202 Ferroalloys: US$16.5 bn (+17.2%)
- HS 7219 Flat-rolled stainless steel: US$5.4 bn (-7.1%)
- HS 7218 Stainless steel ingots and semi-finished: US$2.4 bn (+2.3%)
- HS 7208 Hot-rolled flat steel: US$1.5 bn (+153.5%)
Monthly figures show the trend continuing: iron and steel exports rose almost 10% in value in the first half of 2025.
4. Electrical and electronic equipment (HS 85) — US$19.2 billion
Electronics grew 27.5% and is now Indonesia's fourth-largest export. The standout is solar: photovoltaic cells and semiconductor devices (HS 8541) jumped more than fourfold to about US$3.3 billion as new solar cell and module factories started exporting. Other big lines are telephone and network equipment (US$2.2 bn), insulated wire and cable (US$1.8 bn) and batteries (US$1.2 bn, +52.5%).
5. Vehicles and parts (HS 87) — US$12.2 billion
Indonesia is a regional car-making hub, with Japanese brands building cars in West Java for markets across Asia, the Middle East and Latin America. Passenger cars (HS 8703) brought in about US$6.5 billion (+7.5%), car parts US$2.1 billion, and motorcycles US$1.6 billion (+35.5%). The arrival of EV plants means this chapter is one to watch in 2026.
6. Gems, jewellery and precious metals (HS 71) — US$11.7 billion
Up 31.4%, helped by record gold prices. Jewellery (HS 7113) is the largest line at about US$7.8 billion (+48%), while unwrought gold (HS 7108) roughly doubled to US$2.2 billion.
7. Nickel and nickel products (HS 75) — US$9.7 billion
The other half of the nickel story. Nickel matte and intermediate products (HS 7501) reached about US$8.4 billion (+17.4%), and refined unwrought nickel (HS 7502) rose 57% to US$1.4 billion. Much of this feeds battery supply chains, making Indonesia central to the EV industry. Indonesia holds the world's largest nickel reserves, so expect this chapter to keep climbing.
8. Miscellaneous chemical products (HS 38) — US$9.5 billion
The fastest grower in the top ten at +45.7%. Most of it is palm-based oleochemicals: industrial fatty acids and fatty alcohols (HS 3823) worth about US$7.6 billion (+49.5%), used in soaps, detergents, cosmetics and lubricants. It shows Indonesia moving from selling raw palm oil to selling higher-value products made from it.
9. Machinery and computers (HS 84) — US$8.2 billion
A smaller but more varied group. Printing machinery leads at about US$1.6 billion, and air conditioners, refrigerators and computer equipment all grew sharply in 2025 as manufacturers shifted production into Indonesia. Browse the full chapter under HS 84 machinery.
10. Footwear (HS 64) — US$8.0 billion
Indonesia is among the world's top shoe suppliers and makes sneakers for many global sportswear brands. Textile-upper footwear (HS 6404) grew 23.3% to about US$3.1 billion, leather footwear (HS 6403) was about US$3.1 billion, and rubber or plastic footwear (HS 6402) rose 36.7% to US$1.7 billion.
How Indonesia's exports have moved since 2021
Exports peaked in 2022 during the commodity price boom, dropped in 2023 when coal and palm oil prices cooled, and have been rising again since. The growth now comes less from raw commodities and more from processed metals, electronics and oleochemicals.
| Year | Total exports | Change |
|---|---|---|
| 2021 | US$231.6 bn | – |
| 2022 | US$292.0 bn | +26.1% |
| 2023 | US$258.8 bn | -11.4% |
| 2024 | US$264.7 bn | +2.3% |
| 2025 | US$282.9 bn | +6.9% |
| Jan–Jul 2026 | US$167.0 bn | +4.4% vs Jan–Jul 2025 |
What this means for traders in 2026
- Downstream metals are the growth engine. Ferroalloys, stainless steel and nickel products together are worth more than US$37 billion, and new smelters keep coming online.
- Commodity income is volatile. Mineral fuels and palm oil (HS 27 and HS 15) still make up about 28% of exports, so coal and palm oil prices drive the headline numbers.
- Manufacturing is rising. Solar cells, batteries, vehicles and footwear give buyers more options to source from Indonesia instead of China or Vietnam.
- Watch policy. Export bans, biodiesel blending rules and royalty changes can move volumes quickly, so check monthly shipment data rather than annual totals.
Find buyers and suppliers for any of these products
Annual totals tell you which products matter. Shipment records tell you who is trading them. With our Indonesia export data you can search by product or 8-digit HS code and see every exporter, foreign buyer, quantity, value and destination, updated monthly.
Start with the HS code list, browse the Indonesian exporter directory, or request a free sample for the product you trade.
Figures are rounded and approximate; growth rates compare 2025 with 2024 in US dollar value.
Indonesia Trade Data supplies shipment records only. We do not buy or sell any goods mentioned here; to trade, contact the companies in the records directly.
Want the shipment data behind this?
Ask for a free sample of Indonesia import or export records for your product.
Related articles
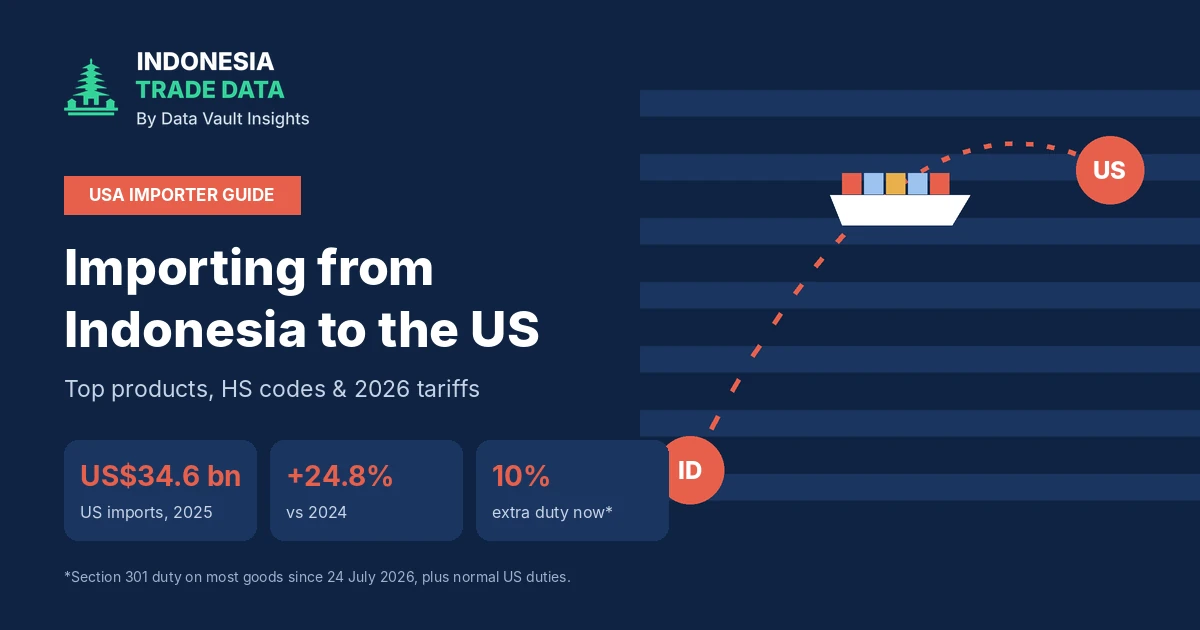
Importing from Indonesia to the USA in 2026: Top Products, HS Codes & Tariffs
The US is Indonesia's biggest Western market, with imports up 24.8% to US$34.6 billion in 2025. This guide for American importers covers the top products and HS codes, the tariffs in force in 2026, and how to find Indonesian suppliers already shipping to the US.
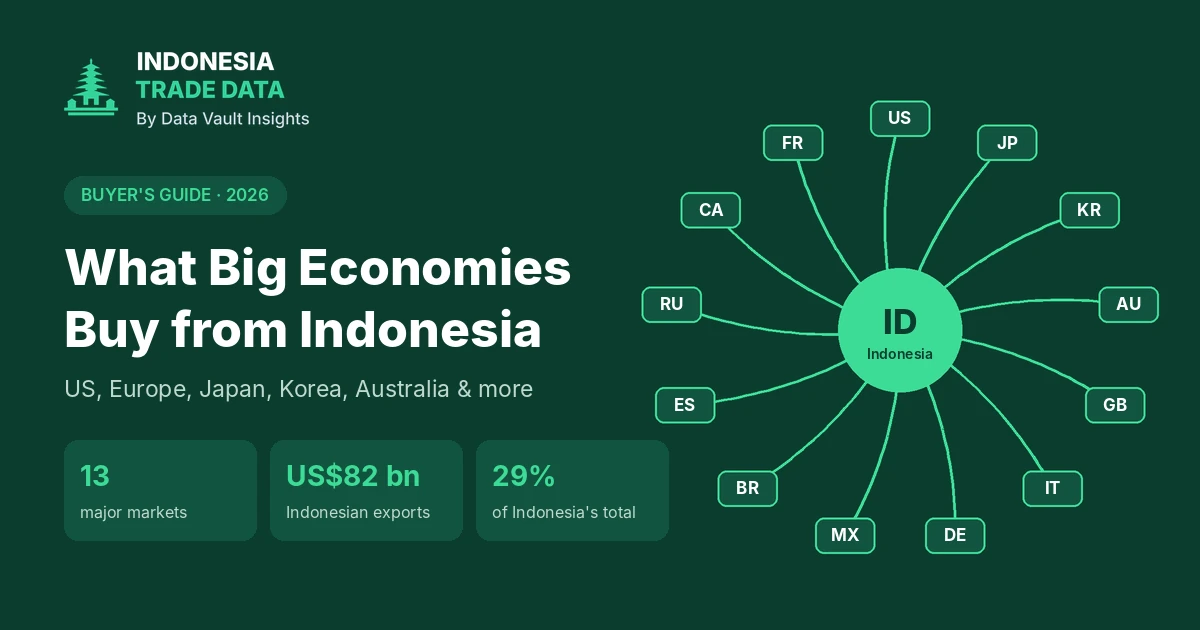
What the US, Europe, Japan & Other Big Economies Import from Indonesia (2026)
Thirteen of the world's largest economies bought about US$82 billion of goods from Indonesia in 2025. This buyer's guide shows what each market imports, from US electronics and footwear to Japanese coal and European palm oil, plus the trade deals that lower duties in 2026 and 2027.
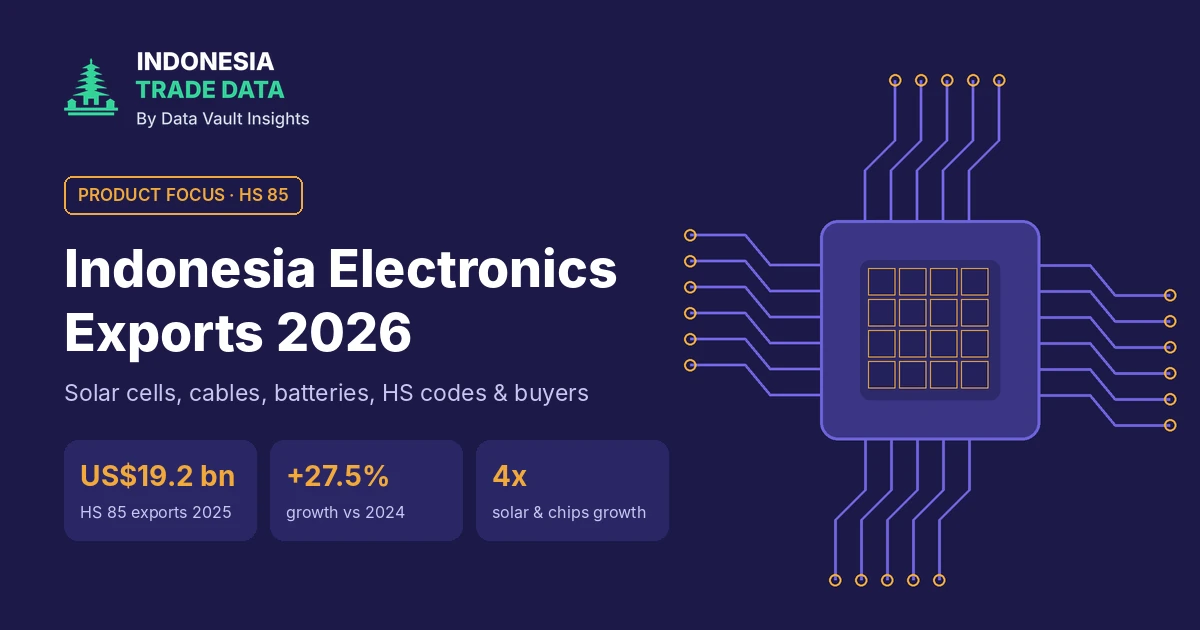
Indonesia Electronics Exports 2026: Solar Cells, HS Codes & Buyers
Indonesia exported US$19.2 billion of electrical and electronic equipment in 2025. Solar cells more than quadrupled, while phones, cables and batteries kept growing. This guide covers HS 85 codes, the top products, the main buyers and the new US solar duties.