
There is a good chance the running shoes in your cupboard were made in Indonesia. Factories in Banten, West Java and Central Java produce sneakers for many of the world's biggest sportswear brands, as well as leather shoes, sandals and slippers for buyers around the world.
In 2025 Indonesia exported US$7.98 billion of footwear, up 9.5% on 2024 and more than 65% higher than in 2020. By number of pairs, it is now the world's third-largest shoe exporter, behind only China and Vietnam. Here is a closer look at the products, the buyers and the outlook for 2026.
Indonesia footwear exports at a glance
| Indicator | Figure |
|---|---|
| Export value, 2025 | US$7.98 bn (+9.5%) |
| Pairs exported, 2025 | About 585–600 million pairs |
| World rank by export volume | No. 3 (4.0% of world exports) |
| Pairs produced, 2025 | 782 million (No. 5 in the world) |
| Largest market | United States, US$2.54 bn (about 32%) |
| Workers in the footwear industry | About 921,000 (early 2025) |
| Industry export target | US$10 bn by 2028–2029 |
How Indonesia compares with other shoe exporters
China still ships six out of every ten pairs of shoes traded worldwide. But Indonesia has steadily climbed the table as brands spread production across Southeast Asia. In 2025 it exported 585 million pairs, more than Germany, India, Cambodia or Italy.
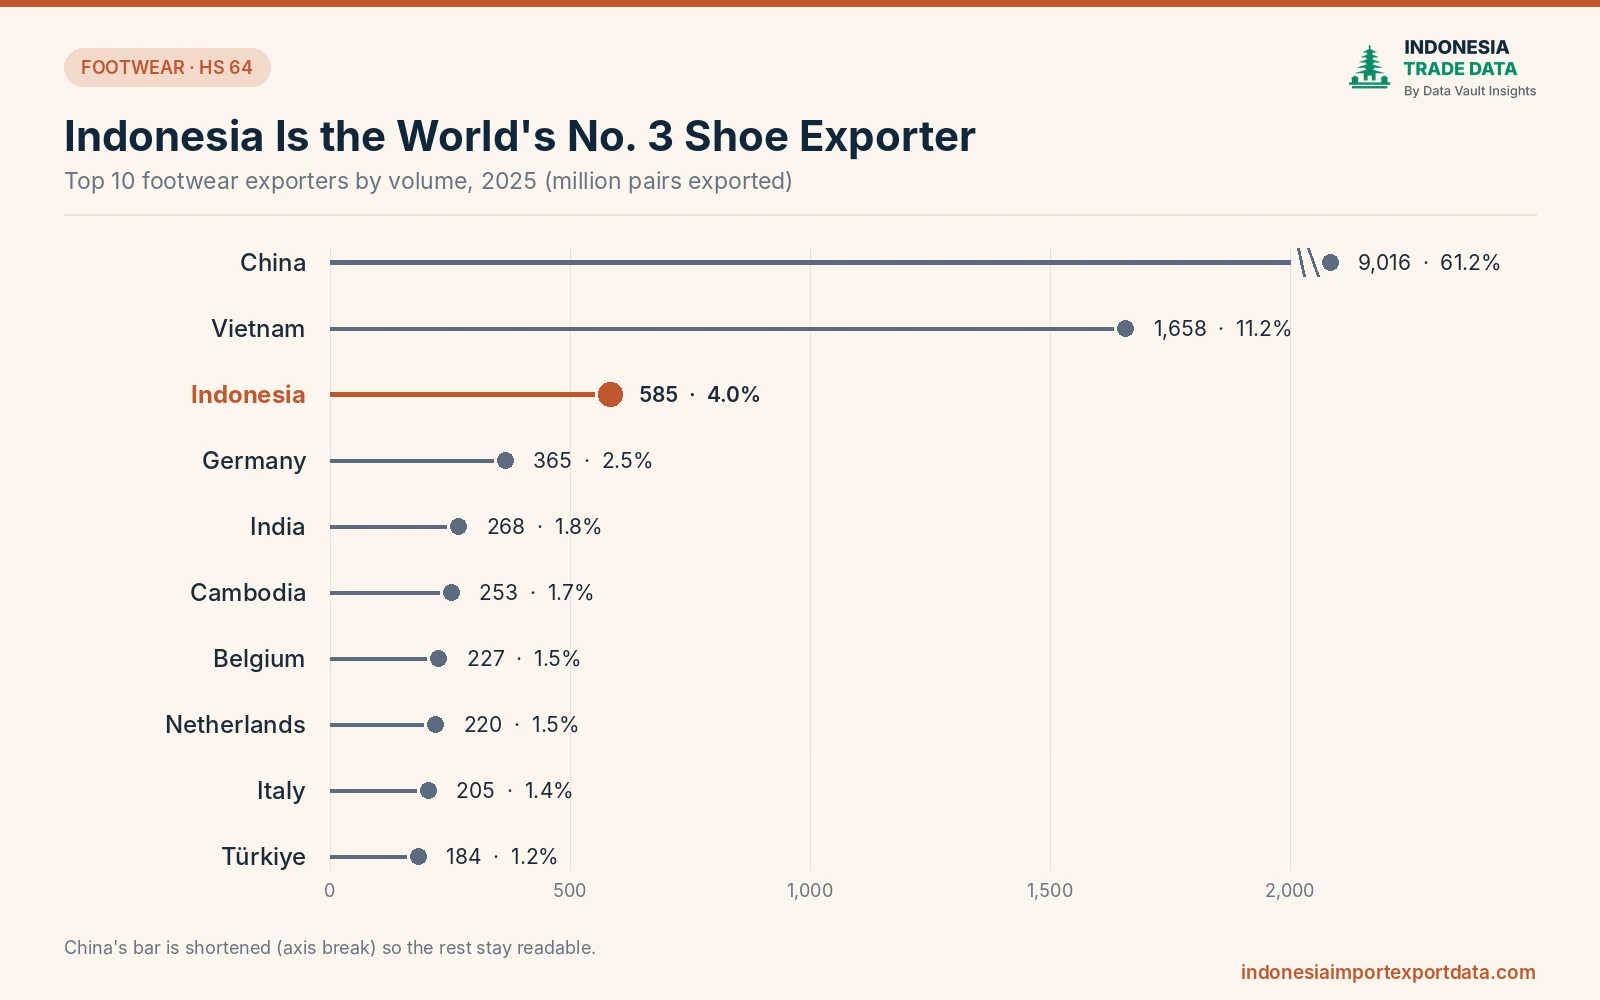
| Rank | Exporter | Pairs exported 2025 | World share |
|---|---|---|---|
| 1 | China | 9,016 million | 61.2% |
| 2 | Vietnam | 1,658 million | 11.2% |
| 3 | Indonesia | 585 million | 4.0% |
| 4 | Germany | 365 million | 2.5% |
| 5 | India | 268 million | 1.8% |
| 6 | Cambodia | 253 million | 1.7% |
Germany, Belgium and the Netherlands rank highly because they re-export shoes made in Asia through European distribution hubs.
Footwear HS codes: what Indonesia exports
All footwear falls under HS chapter 64. The second pair of digits tells you what the upper is made of, which is the main way buyers and customs classify shoes:
| HS code | Product | Typical examples |
|---|---|---|
| 6401 | Waterproof rubber or plastic footwear | Rain boots, gumboots |
| 6402 | Rubber or plastic soles and uppers | Sports sandals, slides, synthetic sneakers |
| 6403 | Leather uppers | Leather sneakers, formal shoes, boots |
| 6404 | Textile uppers | Knit and mesh running shoes, canvas shoes |
| 6405 | Other footwear | Shoes with other upper materials |
| 6406 | Parts of footwear | Uppers, soles, insoles, heel cushions |
You can track shipments for each code under HS 64 footwear.
Sneakers vs leather shoes: the product mix
Two product groups account for more than three-quarters of Indonesia's footwear exports, and they are moving in opposite directions. Textile-upper shoes, mostly athletic and lifestyle sneakers, grew by almost a quarter in 2025 and are now the single biggest line. Leather-upper shoes dipped slightly.
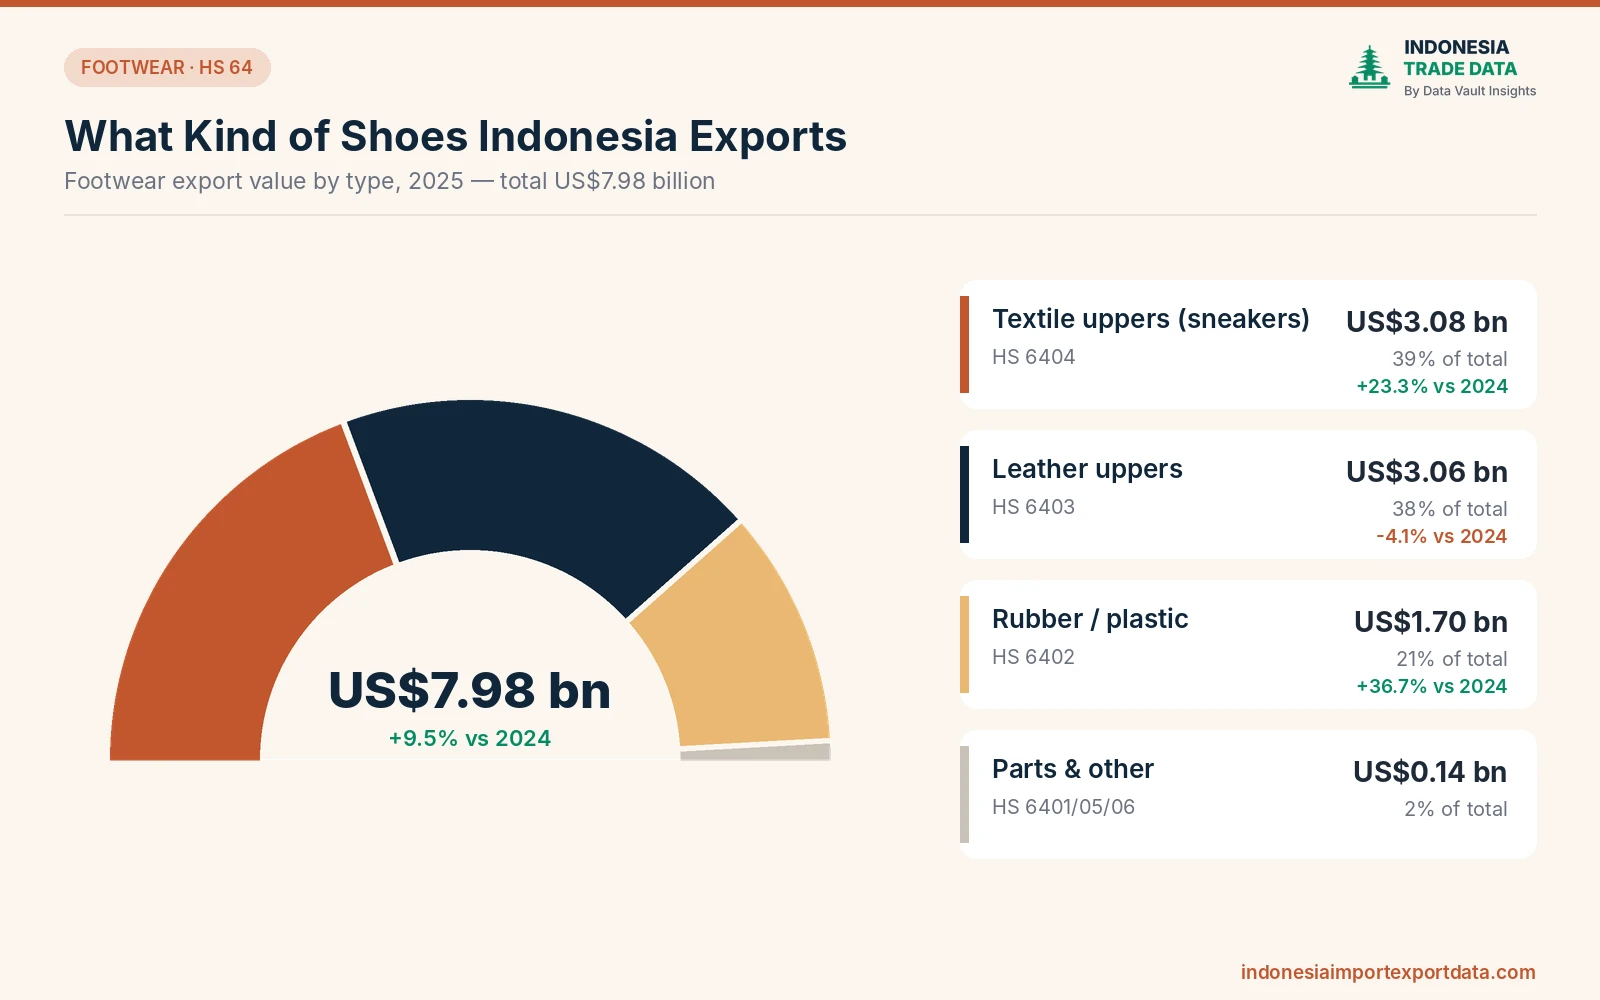
| HS code | Product | Export value 2025 | Share | Change vs 2024 |
|---|---|---|---|---|
| 6404 | Textile-upper footwear | US$3.08 bn | 39% | +23.3% |
| 6403 | Leather-upper footwear | US$3.06 bn | 38% | -4.1% |
| 6402 | Rubber or plastic footwear | US$1.70 bn | 21% | +36.7% |
| 6401, 6405, 6406 | Waterproof, other footwear and parts | US$0.14 bn | 2% | – |
| 64 | Total footwear | US$7.98 bn | 100% | +9.5% |
The fast growth in rubber and plastic footwear reflects strong demand for sports slides, sandals and lightweight synthetic trainers.
Who buys Indonesian footwear?
The United States is by far the largest market, taking about a third of Indonesia's footwear exports. The European Union comes second, with the Netherlands and Belgium acting as entry points for the whole continent. Mexico, South Korea, China, Japan, the UK and Australia make up most of the rest.
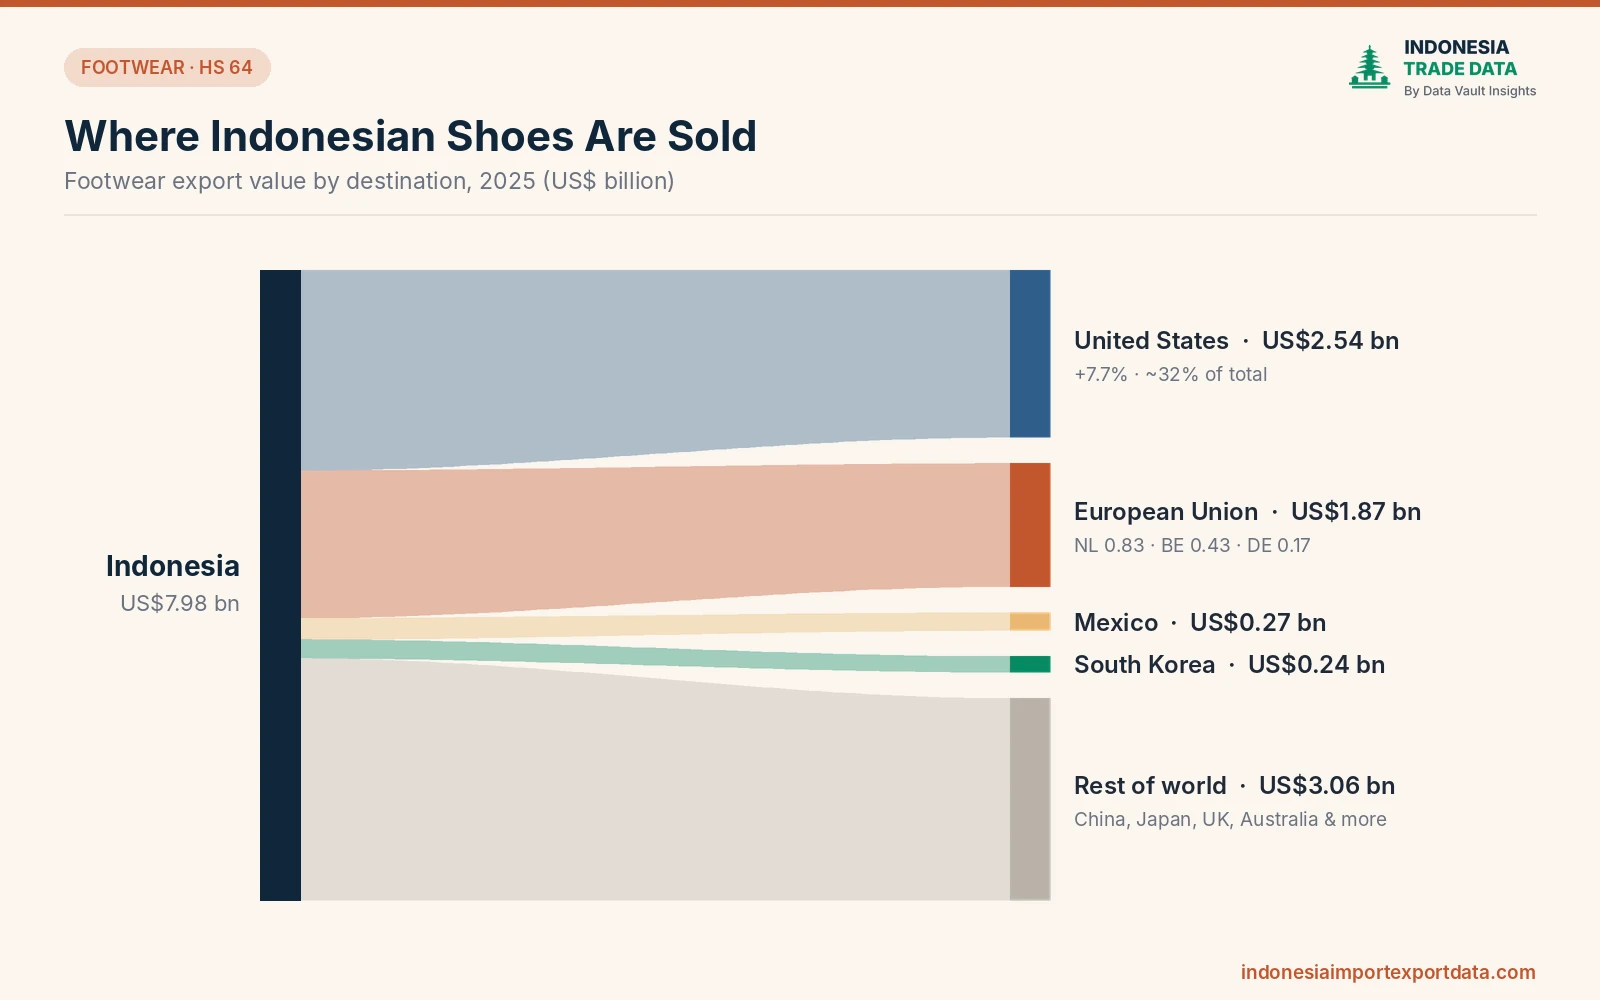
| Market | Footwear imports from Indonesia, 2025 | Note |
|---|---|---|
| United States | US$2.54 bn | +7.7%, about 32% of total |
| European Union (all 27) | US$1.87 bn | Leather and textile shoes split almost evenly |
| – Netherlands | US$834 m | Main EU distribution hub |
| – Belgium | US$431 m | Footwear is Indonesia's No. 1 export to Belgium |
| – Germany | US$167 m | – |
| Mexico | US$269 m | Growing market in Latin America |
| South Korea | US$241 m | Mostly leather and textile sneakers |
By weight, the picture is similar. In the first quarter of 2025, the US took 34% of shipped footwear tonnage, followed by the Netherlands (8.4%), Belgium (7.1%), Japan (5.9%) and China (5.6%).
2026: tariffs, trade deals and new factories
| Factor | What happened | Effect on exports |
|---|---|---|
| US tariff | A 19% reciprocal tariff on Indonesian goods, agreed in July 2025, down from a threatened 32% | Exports to the US still grew 7.7% in 2025; Indonesia remains the No. 3 shoe supplier to the US |
| Indonesia–EU CEPA | Free trade deal concluded in 2025; expected to take effect in late 2026 or 2027 once ratified | Set to cut or remove EU tariffs on most Indonesian goods, including footwear, making EU sales cheaper |
| New investment | Around Rp10 trillion (about US$616 m) from 18 footwear companies in Jan–Aug 2025 | 73 million pairs of extra yearly capacity, plus components |
| Industry target | Exports of US$10 bn by 2028–2029 | Requires growth of about 6–8% a year |
Brands keep moving orders to Indonesia to spread risk away from China and Vietnam. Many new factories are opening in Central Java, where labour costs are lower than in the older Banten and West Java clusters.
What this means for buyers and exporters
- Sneakers lead the growth. Textile-upper and synthetic footwear are rising fastest, so most new capacity is aimed at athletic and casual shoes.
- Watch the EU deal. Once IEU-CEPA takes effect, zero tariffs could make Indonesian shoes more competitive in Europe than those from countries without a deal.
- Price in the US tariff. US buyers now pay a 19% reciprocal tariff on top of existing footwear duties, so landed-cost comparisons between Asian suppliers matter more than ever.
- Check a factory's real shipments. Many exporters are contract manufacturers for big brands. Shipment records show which ones already ship your product type to your market.
Find footwear buyers and suppliers in Indonesia
Annual totals show where the market is heading. Shipment records show who is actually trading. With our Indonesia export data you can search footwear shipments by 8-digit HS code and see the exporter, foreign buyer, number of pairs, value, port and destination, updated every month.
Browse the Indonesian exporter directory, check the HS code list, or request a free sample of footwear export data.
Also read: Top 10 Products Indonesia Exports in 2026, Indonesia Nickel Exports 2026 and Indonesia Palm Oil Exports 2026.
Indonesia Trade Data supplies shipment records only. We do not buy or sell any goods mentioned here; to trade, contact the companies in the records directly.
Want the shipment data behind this?
Ask for a free sample of Indonesia import or export records for your product.
Related articles
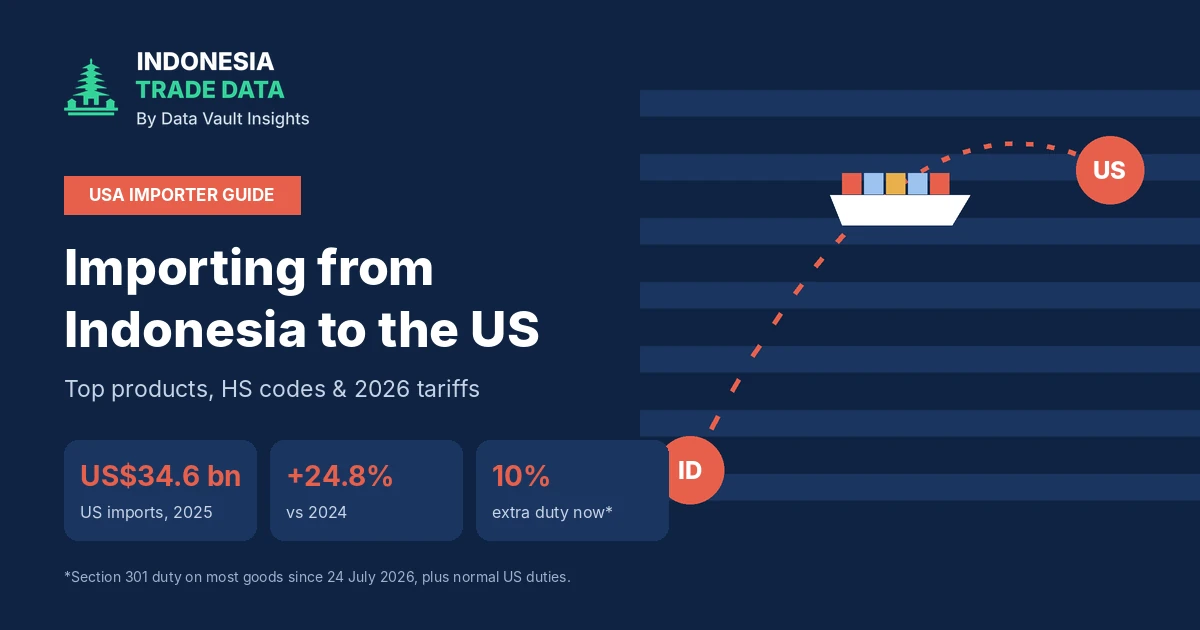
Importing from Indonesia to the USA in 2026: Top Products, HS Codes & Tariffs
The US is Indonesia's biggest Western market, with imports up 24.8% to US$34.6 billion in 2025. This guide for American importers covers the top products and HS codes, the tariffs in force in 2026, and how to find Indonesian suppliers already shipping to the US.
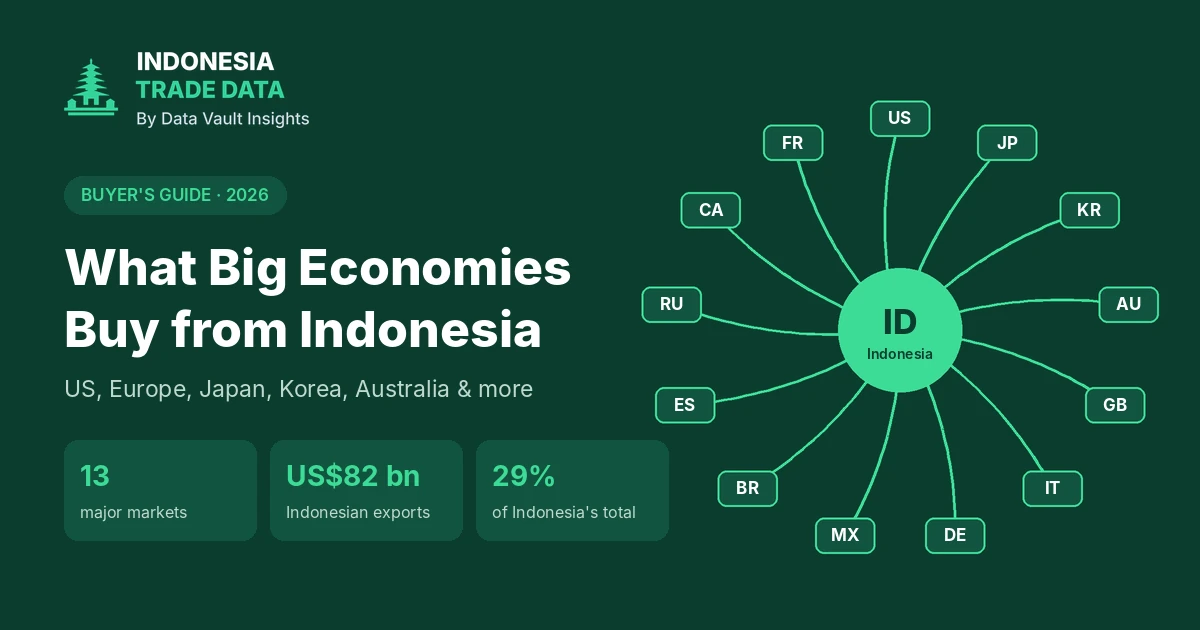
What the US, Europe, Japan & Other Big Economies Import from Indonesia (2026)
Thirteen of the world's largest economies bought about US$82 billion of goods from Indonesia in 2025. This buyer's guide shows what each market imports, from US electronics and footwear to Japanese coal and European palm oil, plus the trade deals that lower duties in 2026 and 2027.
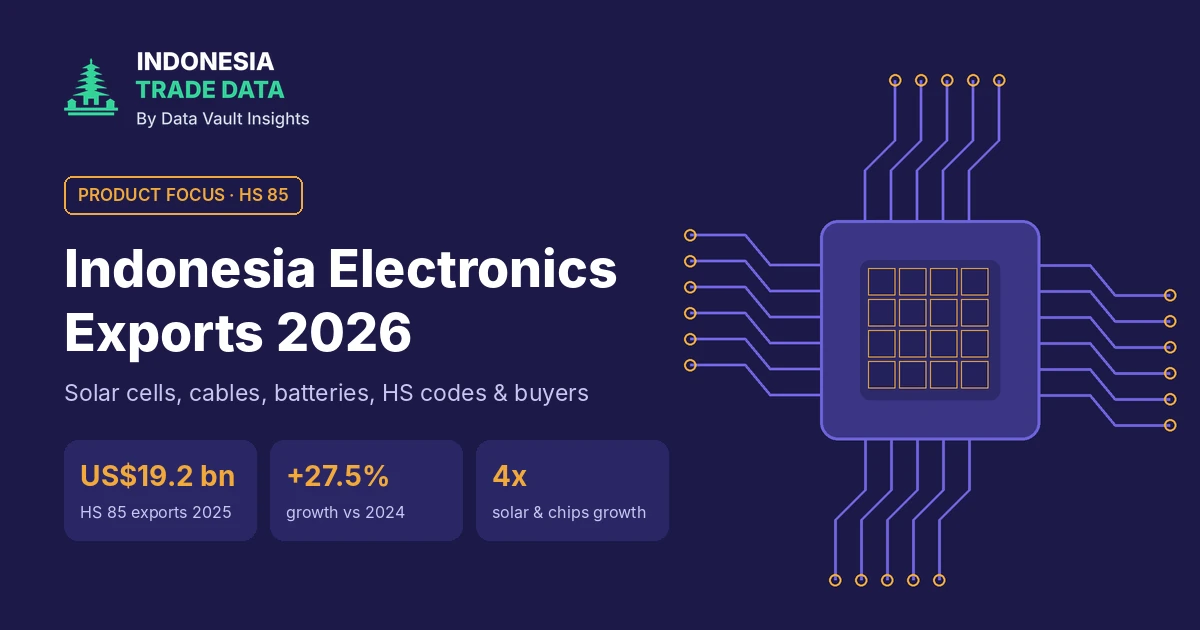
Indonesia Electronics Exports 2026: Solar Cells, HS Codes & Buyers
Indonesia exported US$19.2 billion of electrical and electronic equipment in 2025. Solar cells more than quadrupled, while phones, cables and batteries kept growing. This guide covers HS 85 codes, the top products, the main buyers and the new US solar duties.