

Japan is one of Indonesia's biggest and most steady buyers. In 2025 Japanese buyers took US$17.61 billion of Indonesian goods, about 6.2% of everything Indonesia exported, which makes Japan Indonesia's fourth-largest export market after China, the United States and India.
The headline figure fell 14.9% from 2024. But the drop came almost entirely from three volatile commodity groups: coal and other fuels, copper ore, and gold. Take those out and Indonesia's sales to Japan grew 8.3%, with machinery, vehicles, footwear and nickel all rising. And since 1 August 2026, the amended Indonesia–Japan Economic Partnership Agreement (IJEPA) has cut duties further on a range of products.
This guide shows what Japan buys from Indonesia, the exact HS codes, which lines are growing, and what the amended IJEPA means for Japanese importers.
Indonesia–Japan trade at a glance
| Indicator | Figure |
|---|---|
| Indonesia's exports to Japan, 2025 | US$17.61 bn |
| Change vs 2024 | −14.9% (from US$20.71 bn) |
| Change excluding fuels, ores and gold (HS 27, 26, 71) | +8.3% |
| Japan's share of Indonesia's exports, 2025 | 6.2% |
| Japan's rank among Indonesia's buyers, 2025 | No. 4 |
| Indonesia's rank among Japan's suppliers, 2025 (Japan's own import records) | No. 11, about US$20 bn |
| Largest single product | Coal (HS 2701), US$2.86 bn |
| Amended IJEPA in force | 1 August 2026 |
Japan's own import records put the figure a little higher than Indonesia's export records, because imports are valued with freight and insurance included. Both show the same trend.
What Japan imports from Indonesia: top HS chapters
Energy still leads. Coal and liquefied natural gas together make up more than a quarter of the total. Behind them is a broad industrial mix: electrical goods (mostly cables and wiring), nickel for Japan's stainless steel and battery makers, machinery, rubber, wood products and vehicles.
| HS | Product group | 2024 | 2025 | Change |
|---|---|---|---|---|
| 27 | Mineral fuels (coal, LNG) | US$6.00 bn | US$4.96 bn | −17.3% |
| 85 | Electrical machinery & equipment | US$1.71 bn | US$1.63 bn | −4.8% |
| 75 | Nickel | US$1.05 bn | US$1.20 bn | +14.3% |
| 84 | Machinery & mechanical appliances | US$636 m | US$868 m | +36.5% |
| 40 | Rubber | US$832 m | US$781 m | −6.2% |
| 26 | Ores, slag & ash | US$1.996 bn | US$766 m | −61.6% |
| 44 | Wood & wood products | US$725 m | US$760 m | +4.8% |
| 87 | Vehicles & parts | US$474 m | US$683 m | +44.2% |
| 14 | Vegetable plaiting materials & products n.e.s. | US$503 m | US$575 m | +14.3% |
| 39 | Plastics | US$514 m | US$534 m | +4.0% |
| 64 | Footwear | US$375 m | US$476 m | +26.9% |
| 62 | Woven apparel | US$395 m | US$418 m | +6.0% |
| 03 | Fish & seafood | US$391 m | US$383 m | −2.1% |
| 48 | Paper & paperboard | US$363 m | US$328 m | −9.7% |
| 29 | Organic chemicals | US$281 m | US$296 m | +5.3% |
Indonesia's exports to Japan, official trade data. HS 71 (gold and jewellery) fell from US$1.90 bn in 2024 to US$175 m in 2025.
Top product lines by HS code
At the 4-digit level, ten lines account for about 57% of what Japan buys. The chart compares each line's 2025 value with its range over the last ten years. Coal stands out: at US$2.86 bn it was only about 40% of its 2022 peak of US$7.15 bn, when energy prices spiked.

| HS code | Product | 2025 value | Change vs 2024 |
|---|---|---|---|
| 2701 | Coal | US$2,856 m | −26.3% |
| 2711 | Petroleum gas, incl. LNG | US$2,082 m | +3.1% |
| 7501 | Nickel mattes & intermediate products | US$1,154 m | +12.5% |
| 8544 | Insulated wire & cable | US$892 m | 0.0% |
| 2603 | Copper ores & concentrates | US$756 m | −62.0% |
| 4001 | Natural rubber | US$627 m | −6.1% |
| 1404 | Vegetable products n.e.s. | US$575 m | +14.3% |
| 4412 | Plywood & laminated wood | US$457 m | +2.1% |
| 8708 | Motor vehicle parts | US$421 m | +22.2% |
| 0306 | Shrimp & other crustaceans | US$238 m | +3.7% |
Product notes for Japanese buyers
Energy: coal (HS 2701) and LNG (HS 2711)
Coal fell 26.3% to US$2.86 bn in 2025, while petroleum gas held steady at US$2.08 bn (+3.1%). Together they still made up 28% of Indonesia's sales to Japan. Coal values swing with world prices: the same line was worth US$7.15 bn in 2022.
Metals: nickel (HS 7501) and tin (HS 8001)
Nickel mattes and intermediates rose 12.5% to US$1.15 bn, just below their 2023 high of US$1.28 bn. Unwrought tin jumped 80% to US$151 m. Copper ore (HS 2603) fell 62% to US$756 m, the main reason HS 26 dropped.
Electrical and machinery: HS 8544, 8415, 8532, 8443
Insulated wire and cable is a steady line at about US$890 m a year. The new story is air conditioners (US$232 m, up from US$11 m) and capacitors (US$180 m, up from US$71 m). Printers and copiers added US$229 m.
Rubber, wood and paper: HS 4001, 4412, 4401, 4802
Natural rubber (US$627 m) and plywood (US$457 m) are long-standing staples. Wood chips and pellets grew 37% to US$120 m. Uncoated printing paper was US$229 m.
Consumer goods: footwear and apparel (HS 64, 61, 62)
Footwear rose 26.9% to US$476 m, with both textile-upper (HS 6404) and leather-upper (HS 6403) shoes growing over 20%. Woven apparel added US$418 m and knitted apparel US$251 m.
Where the growth is: fastest-rising lines in 2025
Below the big commodities, several manufactured lines grew fast in 2025. These are often the best places for Japanese buyers to look for new suppliers, because Indonesian factories are clearly adding capacity for the Japanese market.

| HS code | Product | 2024 | 2025 | Change |
|---|---|---|---|---|
| 8415 | Air conditioning machines & parts | US$10.6 m | US$231.6 m | about 22× |
| 8532 | Electrical capacitors | US$71.3 m | US$179.8 m | +152% |
| 8703 | Passenger cars | US$77.0 m | US$174.9 m | +127% |
| 8001 | Unwrought tin | US$83.9 m | US$150.6 m | +80% |
| 4401 | Wood chips, pellets & sawdust | US$87.8 m | US$120.5 m | +37% |
| 6404 | Footwear with textile uppers | US$169.0 m | US$208.0 m | +23% |
| 6403 | Footwear with leather uppers | US$145.8 m | US$176.9 m | +21% |
| 2402 | Cigars & cigarettes | US$124.3 m | US$145.7 m | +17% |
Japan's place among Indonesia's buyers
For most of the last decade Japan was Indonesia's third-biggest buyer, and briefly second in 2018. In 2025 India moved ahead: Indonesia's exports to Japan fell 14.9%, while exports to India fell 9.9%.

| Rank | Market | Indonesia's exports 2025 | Change vs 2024 |
|---|---|---|---|
| 1 | China | US$67.04 bn | +7.4% |
| 2 | United States | US$31.01 bn | +17.6% |
| 3 | India | US$18.32 bn | −9.9% |
| 4 | Japan | US$17.61 bn | −14.9% |
| 5 | Singapore | US$13.70 bn | +12.3% |
| 6 | Malaysia | US$13.10 bn | +8.9% |
| 7 | Viet Nam | US$10.62 bn | +12.1% |
| 8 | Philippines | US$10.22 bn | −4.8% |
| 9 | South Korea | US$10.14 bn | −5.7% |
| 10 | Thailand | US$8.77 bn | +13.8% |
The amended IJEPA: what changed in 2026
The Indonesia–Japan Economic Partnership Agreement has been updated by a protocol signed in August 2024. Both sides finished their approval steps and exchanged notes on 26 June 2026, and the amended agreement entered into force on 1 August 2026.
| Date | What happened | What it means for Japanese buyers |
|---|---|---|
| August 2024 | Protocol amending the IJEPA signed | Wider tariff cuts agreed on both sides |
| 26 June 2026 | Both sides confirm approval is complete | Start date fixed |
| 1 August 2026 | Amended IJEPA enters into force | New preferential duty rates apply to qualifying goods |
| 1 August 2026 | Processed tuna and skipjack tuna | Duty into Japan cut to 0%, from a previous preferential rate of 9.6% |
| 2026 onwards | Phased tariff schedule | Tariff cuts are phased in over several years, so check the rate for your HS code each year |
For seafood buyers, the tuna change is the clearest gain: Indonesian processed tuna now competes in Japan at zero duty. Prepared fish (HS 16) was already growing, up 24.7% to US$174 m in 2025, before the cut took effect.
What this means for Japanese buyers
- Look past the headline fall. The 2025 drop was a commodity price and volume story. Manufactured goods from Indonesia are growing in Japan.
- Claim the IJEPA rate. Preferential duty needs a valid certificate of origin and goods that meet the agreement's rules of origin. Ask suppliers for this before you sign contracts.
- Seafood is now cheaper to land. Processed tuna and skipjack enter Japan duty-free from 1 August 2026, so compare Indonesian offers with other suppliers again.
- New industrial suppliers are emerging. Air conditioners, capacitors, cars and vehicle parts all grew strongly in 2025.
- Plan for energy price swings. Coal and LNG contracts follow world prices. The 2022 peak and the 2025 fall show how much the value can move.
How to find Indonesian suppliers for the Japanese market
- Pick suppliers already shipping to Japan. They know Japanese quality, labelling and packaging standards.
- Filter by HS code. Shipment records show which exporters ship your exact product, how often and in what volumes.
- Benchmark prices. See what other Japanese importers pay for the same HS code before you negotiate.
With our Indonesia export data you can filter shipments by destination (Japan or any other market) and by HS code, to see every Indonesian exporter, their buyers, quantities, values and ports, updated every month.
Browse the Indonesian exporter directory, check the HS code list, or request a free sample of Japan-bound shipment data for your product.
Related guides: What Big Economies Import from Indonesia · Coal · Nickel · Vehicles · Footwear
Indonesia Trade Data supplies shipment records only. We do not buy or sell any goods mentioned here; to trade, contact the companies in the records directly.
Want the shipment data behind this?
Ask for a free sample of Indonesia import or export records for your product.
Related articles

Importing from Indonesia to the EU in 2026–2027: IEU-CEPA, Top Products & New Rules
EU importers are about to get cheaper access to Indonesian goods: the IEU-CEPA trade deal targets a 1 January 2027 start, just as Indonesia loses GSP preferences and EUDR deforestation rules begin. This guide covers what the EU imports from Indonesia, country by country, and the dates that matter.
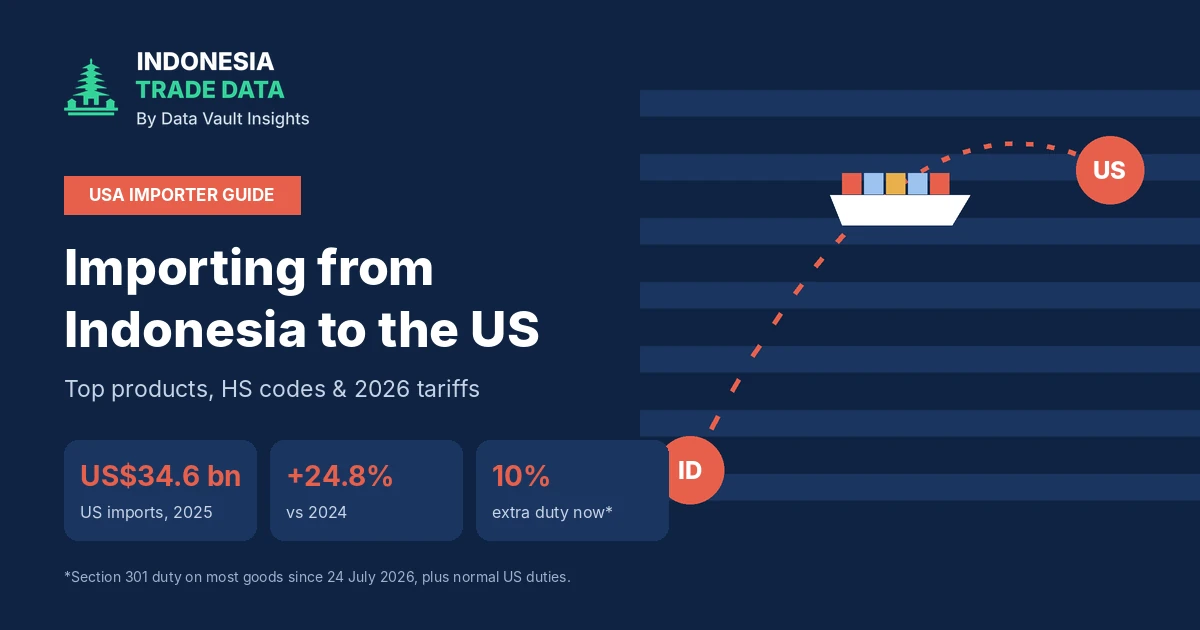
Importing from Indonesia to the USA in 2026: Top Products, HS Codes & Tariffs
The US is Indonesia's biggest Western market, with imports up 24.8% to US$34.6 billion in 2025. This guide for American importers covers the top products and HS codes, the tariffs in force in 2026, and how to find Indonesian suppliers already shipping to the US.
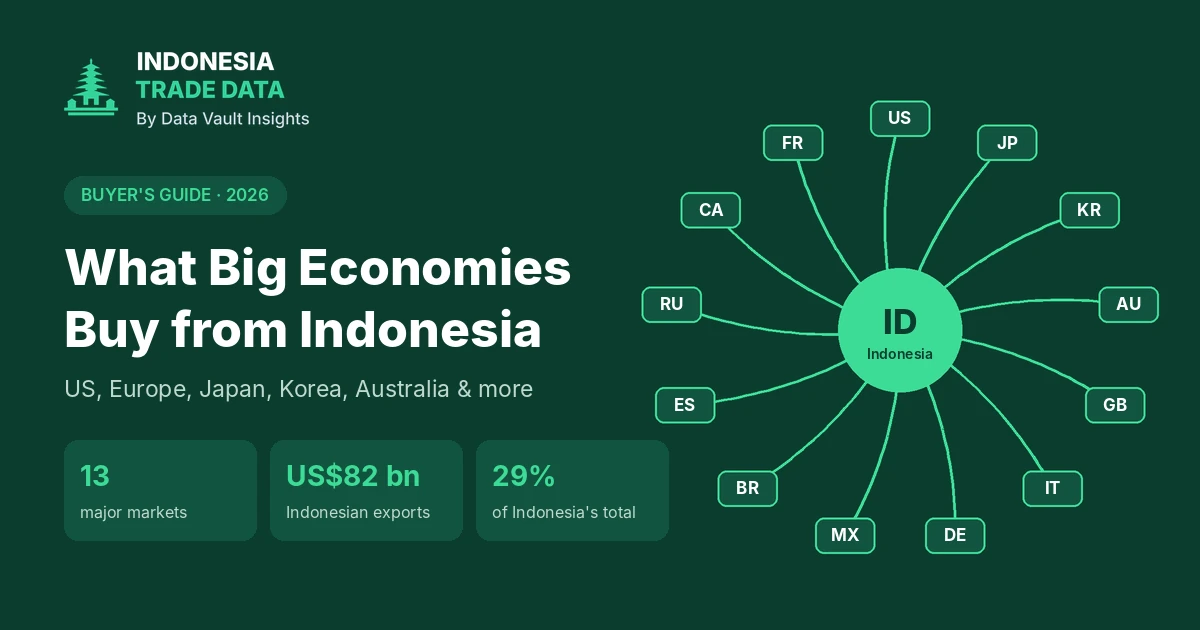
What the US, Europe, Japan & Other Big Economies Import from Indonesia (2026)
Thirteen of the world's largest economies bought about US$82 billion of goods from Indonesia in 2025. This buyer's guide shows what each market imports, from US electronics and footwear to Japanese coal and European palm oil, plus the trade deals that lower duties in 2026 and 2027.